Credit approval using SVM

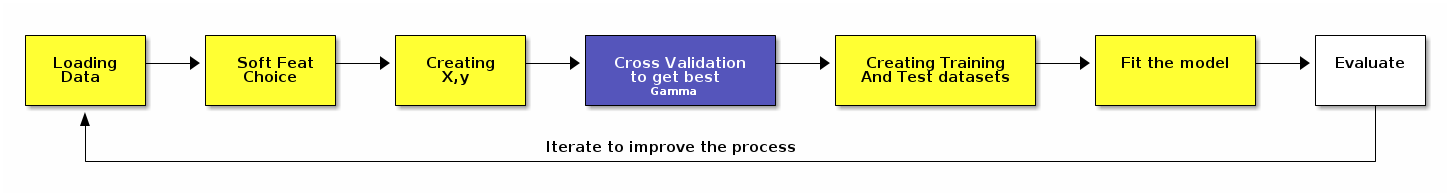
SVM clearly explained!

Here I’m just working with a particular case of SVM, if you’d like to known more, I really recommend you this wonderful video explaining how SVM works in a nutshell for linear and non linear spaces. There’re also a few other references in the resources section.

A little bit of theory

Another type of supervised learning model is SVM or Support Vector Machines or SVM. SVM can be used for both regression and classification purposes. SVM tries to find a decision boundary that best separates different target classes. For linear spaces with two different target classes, we need to find the line (decision boundary for 1-dimensional space) that best classifies both classes. And which is the best line ? The one that maximizes the margin from both classes to the decision boundary or hyperplane.

SVM rewards classifiers by the maximum margin classifier between two different target classes. The higher the distance between two classes the higher is the classifier ranked. This margin can be customized by the classifier’s regularization parameter (normally named C).

How do we know which is the best margin ? Using cross-validation to validate how well the different margins perform and pick up the one that performs the best. Some rules of thumb to keep in mind:

Table 1. Regularization parameter © consequences
AS C …​ REGULARIZATION OVERFITTING MARGIN SENSITIVE TO IND. VALUES

INCREASES

DECREASES

EASIER

SMALLER

YES

DECREASES

INCREASES

HARDER

BIGGER

NO

There’s also the gamma parameter when the SVM kernel used is Radial Basis Function (RBF) (which is the default in scikit learn SVC). The gamma parameter defines how far the influence of a single training example reaches, with low values meaning ‘far’ and high values meaning ‘close’. The behavior of the model is very sensitive to the gamma parameter. If gamma is too large, the radius of the area of influence of the support vectors only includes the support vector itself and no amount of regularization with C will be able to prevent overfitting.

Table 2. Gamma parameter consequences
AS Gamma …​ REGULARIZATION OVERFITTING MARGIN SENSITIVE TO IND. VALUES

INCREASES

DECREASES

EASIER

SMALLER

CLOSE

DECREASES

INCREASES

HARDER

BIGGER

FAR

Credit risks

I’m using a dataset that classifies people described by a set of attributes as good or bad credit risks. There dataset has two versions, I’m using the dataset with all attributes converted to numeric values (german.data-numeric file).

diag aa60cc97f12afddbac7aacbb9e3378c8
Figure 1. process steps

Loading and preparing data

First of all I’m loading the credit data and see how it looks:

loading data
import pandas as pd

cols = [
    'status',
    'duration',
    'history',
    'purpose',
    'amount',
    'savings',
    'employment_since',
    'installment_rate',
    'personal_status',
    'debtors',
    'residence_since',
    'property',
    'age',
    'installment_others',
    'housing',
    'existing_credits',
    'job',
    'people_being_liable',
    'telephone',
    'foreign_worker',
    'label'
]

credit = pd.read_csv('german.data', engine='python', sep='\s+', names=cols)
credit.head()
data
Figure 2. raw data

The problem is that I need to get rid of categorical data and convert everything into numerical data. I’m creating a function that takes all unique values of a given series and maps every categorical value to a given number.

converting categorical data to numeric
import numpy as np

def to_numerical(series):
    uniques = np.sort(series.unique())
    nvalues = range(1, len(uniques) + 1)
    xmap    = dict(zip(uniques, nvalues))

    return series.map(xmap).astype(int)


cols_not_to_convert = [
    'duration',
    'installment_rate',
    'age',
    'amount',
    'existing_credits',
    'people_being_liable',
    'label'
]
cols_to_convert = [e for e in cols if e not in cols_not_to_convert]

for col in cols_to_convert:
    credit[col] = to_numerical(credit[col])

credit.head()

Now all columns show numerical data ready to be used.

to_numerical
Figure 3. numerical data

Soft features choice

As I’m usually doing nowadays, the first thing I do is to create a correlation matrix so I can see which features could clearly work with the label chosen and which don’t

correlation matrix
import seaborn as sns
import matplotlib.pyplot as plt
import numpy as np

corr_matrix = np.corrcoef(credit.T)

plt.figure(figsize=(15, 15))
sns.heatmap(
    corr_matrix,
    cbar=False,
    annot=True,
    square=True,
    xticklabels=cols,
    yticklabels=cols
)
correlation
Figure 4. correlation matrix

Creating X,y

From the correlation matrix, I’ve chosen those features tighly related with the label, and those that are tighly related to the aforementioned features. With this information I can now create the X (features) and y label sets.

feature_cols = [
    'duration',
    'amount',
    'job',
    'age',
    'history',
    'employment_since',
    'telephone',
    'existing_credits',
    'savings',
    'property'
]

X = credit[feature_cols]
y = credit['label']

Cross validation

While reading about SVM, it came across the concept of cross validation. In this particular case is helping me to choose the best value for gamma.

import pandas as pd
from sklearn.svm import SVC
from sklearn.model_selection import validation_curve

def extract_best_numbers(params, train_pcts, test_pcts):
    trains = pd.DataFrame(dict(zip(params, train_pcts))).T
    tests  = pd.DataFrame(dict(zip(params, test_pcts))).T

    trains['train_mean'] = trains.mean(axis=1)
    tests['test_mean']  = tests.mean(axis=1)

    return (trains[['train_mean']]
        .copy()
        .merge(
            tests[['test_mean']].copy(),
            left_index=True,
            right_index=True
        ))

def cross_validation_gamma(X, y, gamma_min, gamma_max):
    param_range = np.linspace(gamma_min, gamma_max, num=20)
    train_scores, test_scores = validation_curve(
        SVC(),
        X,
        y,
        param_name="gamma",
        param_range=param_range,
        cv=5)

    return extract_best_numbers(param_range, train_scores.tolist(), test_scores.tolist())

gamma_dataframe = cross_validation_gamma(X, y, 0.001, 0.1)
gamma_dataframe.head()

The cross validation results returns the gamma values and the mean scores for training and test datasets. I should look for the results with higher test_mean and lower train_mean. Meaning that I’m looking for a value of gamma that maximizes the generalization and minimizes the complexity of the model.

gamma
Figure 5. Gamma values

I wanted to show visually how training and test datasets were behaving depending on the gamma values provided.

import matplotlib.pyplot as plt

def show_svc_param_performance(dataframe, param_name):
    x = dataframe.index

    plt.figure(figsize=(10, 6))
    plt.title("SVC {}".format(param_name.upper()))
    plt.xlabel('{} VALUE'.format(param_name.upper()))
    plt.ylabel('MODEL SCORE')
    plt.grid(axis='both')
    plt.yticks(np.arange(0.00, 1.10, step=0.10))
    plt.xticks(np.arange(0.00, 1.10, step=0.10))

    # drawing test and training performance lines
    plt.plot(x, dataframe['train_mean'], label='TRAINING SCORE', color='red')
    plt.plot(x, dataframe['test_mean'], label='TEST SCORE', color='green')

    # drawing limiy where train score is still ok
    limit_x = dataframe[dataframe['train_mean'] >= 0.80].index[0]
    plt.vlines(limit_x, ymin=0, ymax=1, linestyle='--', color='red', alpha=0.4)
    plt.annotate("Recommended Gamma: {}".format(limit_x), xy=(limit_x + 0.005, 0.5))
    plt.legend(loc="lower right")
    plt.show()

show_svc_param_performance(gamma_dataframe, "gamma")
gamma_chart
Figure 6. Gamma evolution chart

Splitting Dataset

Ok so now that I know the best value of gamma, I can start preparing the training and test datasets that are going to feed the model.

from sklearn.model_selection import train_test_split

X_train, X_test, y_train, y_test = train_test_split(X, y, random_state=10)

Fit the model and evaluate scores

Then I’m fitting the model and getting the score for the training and test datasets using the best gamma value I was able to get. If you use 'auto' as the value for gamma, scikit learn will use 1 / n_features instead.

Fit the model and evaluate scores
from sklearn.svm import SVC

gamma_value = 0.001

svc = SVC(gamma=gamma_value).fit(X_train, y_train)

score_train = svc.score(X_train, y_train)
score_test  = svc.score(X_test, y_test)

score_train, score_test
scores
(0.8066666666666666, 0.68)

Although the training dataset is not bad, the test dataset is still far from giving me a fair result. But it’s clear that the gamma value helped to avoid overfitting the model.

Iterating

In order to help the model I used the sklearn.preprocessing.MinMaxScaler transformation to make all features to share a common scale. It improved a bit the performance of the test scoring and reduced the model complexity.

transforming the features
from sklearn.preprocessing import MinMaxScaler

scaler = MinMaxScaler()
X_train_scaled = scaler.fit_transform(X_train)
X_test_scaled  = scaler.transform(X_test)

I ran the cross_validation_curve from 1 to 5 to see which value of gamma would be the best:

getting gamma values
scaled_cross_validation = cross_validation_gamma(X_train_scaled, y_train, 1, 5)
scaled_cross_validation.head()

And finally I executed the model again with the new gamma value:

from sklearn.preprocessing import MinMaxScaler

svc = SVC(gamma=1).fit(X_train_scaled, y_train)

score_train = svc.score(X_train_scaled, y_train)
score_test  = svc.score(X_test_scaled, y_test)

score_train, score_test

Giving me a slightly better result

score
(0.7666666666666667, 0.724)

Some final thoughs:

  • I’m not convinced on how to extract best gamma values from the cross validation procedure.

  • Is there a combinatorial way to get the best (c, gamma) pair that I still don’t know about ?

  • Maybe SVM was not the best technique for this classification problem

  • It seems that normalization helps to get better results in SVM problems