Model Evaluation: Confusion Matrix
The machine learning workflow usually involves several steps: getting a representation of the data, looking for the most suitable features, train the model with those features, and finally check whether the current model fits the solution we were aiming for or not. This last step is called evaluation and tries to check whether our model fits our purposes or not.
Accuracy
Most of the time I’m focusing on getting the highest score when training my machine learning models. The score I’m looking for is based on accuracy. The accuracy here is the number of predicted samples that were correctly labeled divided by the total number of samples.
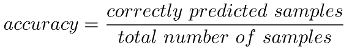
Figure 1. accuracy formula
Is not a bad estimate to get started but is not a silver bullet. Depending on the problem, accuracy may not be the best evaluation method. For example, if we’re dealing with a health related machine learning problem, such as classifying a certain type of cancer cases, even a 90% of accuracy is not good enough. In this case we are ok by having false positives if we’re sure that we don’t miss any true positive. False positives can be validated by a doctor afterwards.
Confusion Matrix
In order to choose which could be the most suitable metric used for a given problem, we need to know which is the goal of the solution.
-
Is a health related app and we want to make sure we don’t miss any positive case
-
We need to store items into boxes and we need to make sure the accuracy is close to 100%, in other words, to be accurate
One helpful way to visualize how the model is performing is to use a confusion matrix. A confusion matrix is a matrix were all posible outcomes of the model are classified in different quadrants. Depending on which quadrant is most important for us to highlight as result, we will choose the classifier that fits best the quadrants we are interested in. An evaluation matrix for a binary classification problem could look like the following:
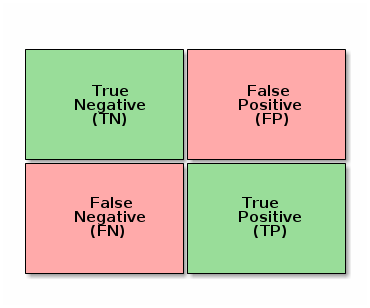
Figure 2. Confusion matrix
Lets create a theoretical example. Lets say we have a binary classification problem. We’re classifying images, and we need to classify 100 images between cats and dogs. The confusion matrix for my actual model is the following:
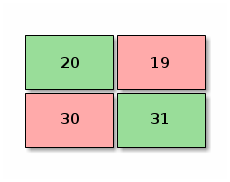
Figure 3. Binary classification
If we establish that the positive class (1) is to find a dog and a negative class (0) is to find a cat, according to this confusion matrix of a 100 samples we can make certain assumptions:
-
20% of the time the model classifies correctly that a given animal is not a dog (True Negative - TN)
-
30% of the time the model classifies incorrectly that a given animal is not a dog (False Negative - FN)
-
19% of the time the model classifies incorrectly that a given animal is a dog (False Positive - FP)
-
31% of the time the model classifies correctly that a given animal is a dog (True Positive - TP)
The evaluation matrix helps us to sort all of the samples in four different boxes and then applying different metrics depending on the goal we’re aiming, Do we want to not miss any dog even if we accept to classify a cat as a dog from time to time ? Do we want to have a 100% of accuracy classifying dogs ? How 100% of accuracy would be represented in the confusion matrix by the way ?
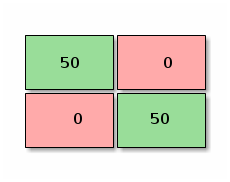
Figure 4. Accuracy metric
But as we’re mentioned so far, we may want to prioritize some other type of metric. Other metrics could be: precision, recall or specificity.
Precision, Recall and F1 score
Precision
If you’d like to maximize precision, that would mean (in the current example), that everytime we say a given sample is a dog, it’s going to be a dog. But that also could mean that when we say something is a cat we may find out it’s a dog.
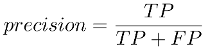
Figure 5. precision formula
In our example our first model was performing like this:
Figure 6. Precision
Calculating the precision would give us 31 / 31 + 19 = 0.62, 62% precision. A model that improves precision would look like the following:
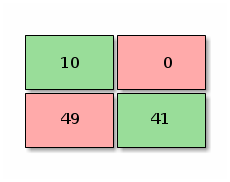
Figure 7. Improved precission
Which would give us a precision of: 41 / 41 + 0 = 1, 100% precision. Notice we are still missing some dogs (49 dogs are classified as false negatives), but here the point is that whenever the model say it’s a dog, it’s a dog.
Recall
What if we don’t want to miss any dog even though we can end up classifying cats as a dog ? We want a high recall. First the formula:
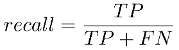
Figure 8. recall formula
We start with a model that performs like this:
Figure 9. Recall
Calculating the recall we end up with: 31 / 31 + 30 = 0.508, around 50% of time time when we say it’s a dog it’s a dog, that’s not better than flipping a coin. Let’s checkout another model:
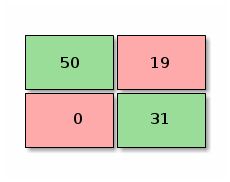
Figure 10. Improved recall
In this ocassion we’ve got that: 31 / 31 + 0 = 1, 100% of recall. This time this would mean that every time we say a dog is a dog we may get a cat, but we are completely sure, that no dogs have been classified as cats. Looking at the matrix:
-
50% of the samples have been correctly classified as cats (True Negative - TN)
-
0% of the samples have been incorrectly classified as cats (False Negative - FN)
-
19% of the samples have been incorrectly classified as dogs (False Positive - FP)
-
31% of the samples have been correctly classified as dogs (True Positive - TP)
F1 score
F1 score combines precision and recall into a single number. The formula is:

Figure 11. f1 score formula
As it’s mentioned this article F1 Score might be a better measure to use if we need to seek a balance between Precision and Recall AND there is an uneven class distribution (large number of Actual Negatives).
Using Scikit to show metrics
To show how confusion matrix can help deciding which classifier to use I’m using a dataset from Madrid City Open Data. This dataset shows the interventions of the urgency and rescue city service (SAMUR in spanish) in 2020.
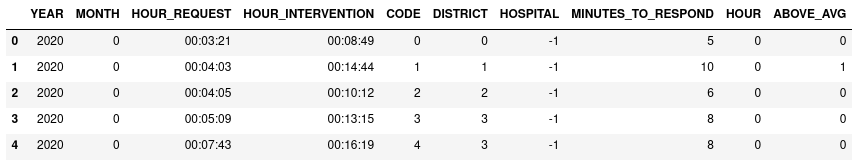
With this dataset I’d like to be able to find a classifier that answers the question: Is this type of intervention going to take to the urgency service more time than average to respond ?
First I did some work to prepare the data the best I could:
-
Converting categorical data to numerical
-
Applying under-sampling to correct imbalance
-
Choosing best features
Then I chose several classifiers:
classifiers
from sklearn.linear_model import LogisticRegression
from sklearn.svm import LinearSVC
from sklearn.neighbors import KNeighborsClassifier
from sklearn.tree import DecisionTreeClassifier
from sklearn.ensemble import RandomForestClassifier, AdaBoostClassifier
from sklearn.dummy import DummyClassifier

# different classifiers
logistic    = LogisticRegression().fit(X_train, y_train)
svc         = LinearSVC(random_state=0).fit(X_train, y_train)
knn         = KNeighborsClassifier(5).fit(X_train, y_train)
tree        = DecisionTreeClassifier(max_depth=3).fit(X_train, y_train)
rff         = RandomForestClassifier(max_depth=2, n_estimators=4, max_features=2).fit(X_train, y_train)
ada         = AdaBoostClassifier(n_estimators=100).fit(X_train, y_train)
dummy       = DummyClassifier(strategy = 'most_frequent').fit(X_train, y_train)
And then I printed out their confusion matrices:
confusion matrix of every classifier
from sklearn.metrics import confusion_matrix

classifiers = [dummy, logistic, svc, knn, tree, rff, ada]

for clsf in classifiers:
    y_predicted = clsf.predict(X_test)
    print(clsf.__class__.__name__)
    print('===========================================')
    print(confusion_matrix(y_test, y_predicted))
    print()
Here’s a nicer representation of the confusion matrices.
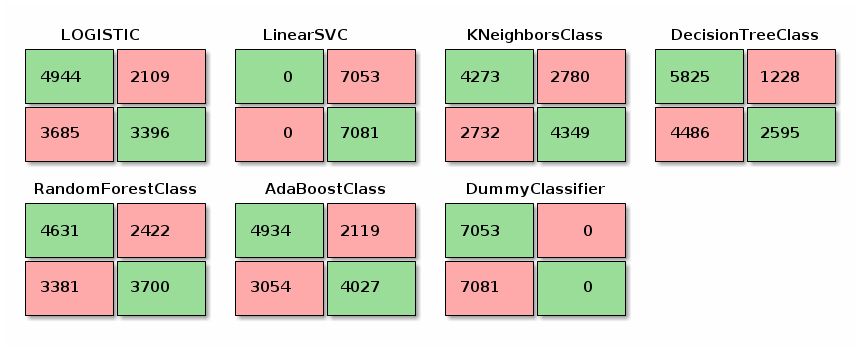
Figure 12. Confusion matrices
First impressions:
-
None of them is performing at a decent level
-
Is not even possible to see a decent recall because both dummy and linear classifiers are the different sides of choosing the most frequent outcome… useless.
-
I’d say that the classifier that gives me the highest precision is the AdaBoostClassifier.
But to be sure, I’m producing the precision, recall and f1-score summary with sklearn’s classification_report of each of them:
summary
from sklearn.metrics import classification_report

classifiers = [dummy, logistic, svc, knn, tree, rff, ada]

for clsf in classifiers:
    y_predicted = clsf.predict(X_test)
    print(clsf.__class__.__name__)
    print('===========================================')
    print(classification_report(y_test, y_predicted, target_names = ['above_avg', 'not_above_avg']))
I’m summarizing the results in the following table:
| Classifier | Precision | Recall | F1 |
|---|---|---|---|
DummyClassifier |
0.50 |
1.00 |
0.57 |
LogisticRegression |
0.57 |
0.70 |
0.63 |
LinearSVC |
0.00 |
0.00 |
0.00 |
KNeighborsClassifier |
0.61 |
0.61 |
0.61 |
DecisionTreeClassifier |
0.56 |
0.83 ←---- |
0.67 |
RandomForestClassifier |
0.58 |
0.66 |
0.61 |
AdaBoostClassifier |
0.62 ←---- |
0.70 |
0.66 |
The summary is telling me that the classifier that ranks best for precision is the AdaBoostClassifier and the classifier that ranks best for recall is the DecisionTreeClassifier. The take-away is:
-
If I wanted to be sure that I’m missing the few positive samples possible I’d look for the highest recall classifier
-
If I wanted to be sure that I’m getting a true positive sample every time I’d look for the highest precision classifier
And finally, this whole evaluation process has serve to realize that I need to go back to square one, because as I mentioned earlier NONE of the classifiers is performing decently, so I need to check where I can improve the process:
-
Enrich data
-
Increase/Decrease samples
-
Tune classifiers to get the desired precision/recall/accuracy…
Resources
-
Confusion Matrix: Wikipedia definition
-
Different Evaluation Metrics: Interesting article talking about different evaluation metrics
-
Accuracy, precision, recall or F1: article in towardsdatascience.com