Model Evaluation: Decision functions
Another tool for evaluating a classifier are decision functions. Decision functions show you how a given classifier is classifying positive and negative samples depending on a specific threshold value. Knowing the threshold and the score of each sample can help you deciding whether or not to raise or decrease the threshold in order to vary the classification behavior towards recall or precision.
Decision functions and threshold
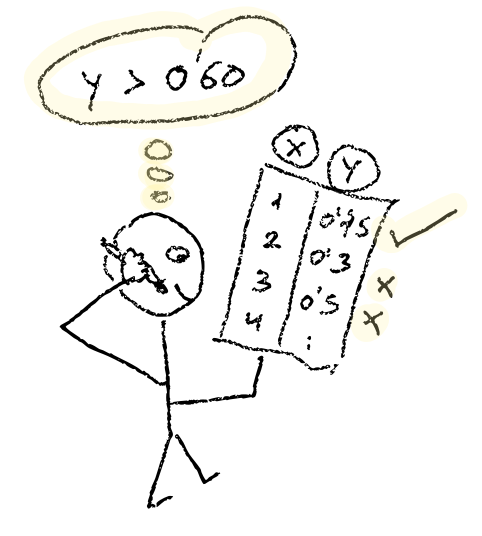
In a binary classification problem a decision function could be thought as a simple function deciding whether a given sample lies within the positive class or the negative class. They do that by having a threshold value as a reference, anything above or equal to that threshold is considered positive, whereas anything below that threshold is considered negative.
Taiwanese bankruptcy
I’m using a dataset from Kaggle about company bankruptcy prediction. After preparing the data, I came up with these three classifiers parametrized:
from sklearn.linear_model import LogisticRegression
from sklearn.tree import DecisionTreeClassifier
from sklearn.neighbors import KNeighborsClassifier

log = LogisticRegression(C=1).fit(X_train, y_train)
knn = KNeighborsClassifier(n_neighbors=5).fit(X_train, y_train)
dtc = DecisionTreeClassifier(max_depth=6).fit(X_train, y_train)
I’d like to know how they perform in terms of precision-recall scoring depending on different classification thresholds.
I’d like to get predicted values from every classifier, to because I’m not sure which one has decision_function or predict_proba I’ve created the following function to help me out:
decion_function vs predict_proba
def get_y_predict(clsf, samples):
    dec_fun = getattr(clsf, 'decision_function', None)
    if dec_fun:
        return clsf.decision_function(samples)
    else:
        # only interested in positive score
        return clsf.predict_proba(samples)[0:, 1:]
Now I’m drawing what is called a precision-recall curve, which shows how the precision and the recall evolve depending on the threshold value used each time. This can help me choosing a specific threshold depending on what I’d like to prioritize precision or recall, or maybe a balance between both.
In this example, I’d like to highlight where precision and recall values are for a threshold of 0.75:
Plotting precision-recall curve
import numpy as np
from sklearn.metrics import precision_recall_curve
import matplotlib.pyplot as plt

# threshold I'm interested in
THRESHOLD = 0.75

plt.figure()
_, ax = plt.subplots(1, 3, figsize=(15, 4))
cols  = 0

# plotting precision-recall charts
for classifier in lst:
    y_predict = get_y_predict(classifier, X_test)
    precision, recall, thresholds = precision_recall_curve(y_test, y_predict)
    ax[cols].title.set_text(str(type(classifier).__name__))
    ax[cols].set(xlabel='Precision', ylabel='Recall')
    ax[cols].step(precision, recall)
    criteria = np.argmin(np.abs(thresholds - THRESHOLD))
    ax[cols].plot(precision[criteria], recall[criteria], 'o', c='r')
    ax[cols].grid(axis='both', linestyle='--', c='#cccccc')
    cols+=1

plt.show()
Here is how the precision-recall curves look like for every classifier:
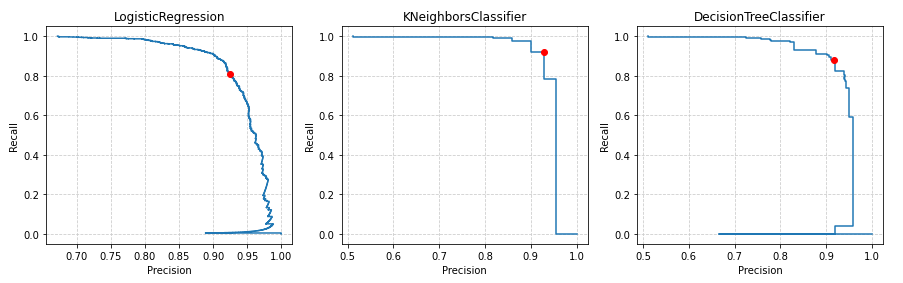
Now, keeping in mind that here my goal is to maximize the recall, that is, to detect as many companies likely to go down to avoid investing in them for example, the classifier I’d choose is the KNeighborsClassifier as it reaches the highest recall. In these charts I’ve highlighted with a red point the precision/recall point for a threshold of 0.75.
| Also notice that the ideal point for a classifier would be the top right at (1.0, 1.0) that is the point where precision and recall would be maximized. |
Resources
-
Taiwanese bankrupcy prediction: from Kaggle
-
Fine Tuning Scikit-learn classifiers Article: from Towards Data Science site
-
taiwan.ipynb: Taiwanese companies bankruptcy notebook