Classifying food
Next station in my machine learning journey is the Supervised Learning method. In this article I’m using Supervised Learning Classification to classify food into three categories: green, orange or red depending on whether they’re healthy or not. In order to get used to the methodology I’m sticking to the representation-evaluation-optimization process.
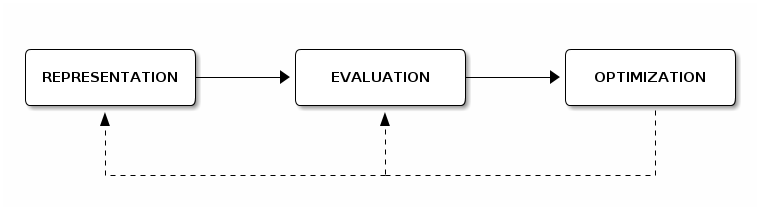
Figure 1. representation → evaluation → optimization
Representation Phase
In the representation phase we should find a representative dataset and a suitable algorithm for the problem at hand. Then we use both, dataset and algorithm, to train a software model to make predictions.
Dataset preparation
A representative dataset, in this case, would be a large dataset of food, labeled as good/bad/not-so-good food. I created a csv file with more than three thousand food entries, collected from this site (Spanish).
loading data
import pandas as pd

food = pd.read_csv('food.csv', sep=';').fillna(0)
food.head()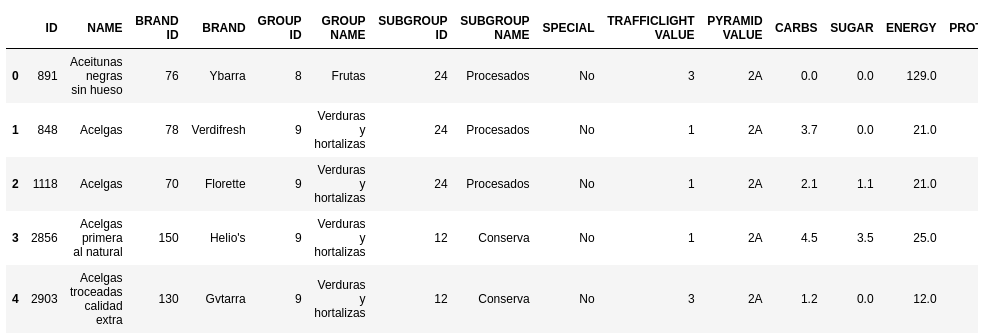
Figure 2. food dataset
Each entry has a series of possible features and it’s labeled with a color value (TRAFFICLIGH VALUE) which depends on whether it is a healthy food, not so healthy food or junk food. Next I should choose every column that can be eligible as a feature, for example the name of the food is not a good feature if you’d like to generalize the results.
choosing possible features
COLUMNS_OF_INTEREST = [
    "TRAFFICLIGHT VALUE",
    "CARBS",
    "SUGAR",
    "ENERGY",
    "PROTEINS",
    "SATURATED FAT",
    "FAT",
    "SODIUM",
    "FIBER",
    "SALT",
]

df = (food
    .copy()
    .loc[:, COLUMNS_OF_INTEREST]
    .dropna())

df.head()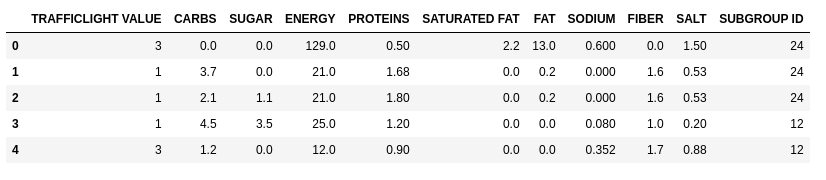
Figure 3. possible features
However the goal is to choose the minimum set of features that maximizes the classification. Too many could classify well but it would become too hard to use, too few would not classify well enough. I need to find the balance between the two. Once I’ve found the balance I can use both, features and labels to create a training and test datasets. For that I use the train_test_split function from scikit-learn library.
minimum set of features and creating training and test datasets
from sklearn.model_selection import train_test_split

feats = df[['CARBS', 'SUGAR', 'PROTEINS', 'FAT', 'SALT', 'FIBER']]
label = df['TRAFFICLIGHT VALUE']

X_train, X_test, y_train, y_test = train_test_split(feats, label, random_state=0)
Drawing a scatter matrix sometimes could help you to spot features that are particularly good on classifying samples. I did the matrix, but I recognize that although some of the feature-pairs are clearly better than others (e.g. proteins/carbs) many of them are inconclusive to me (e.g. salt/fat). I invite you to open the plot in a new window, full size, and take a look for yourself:
matrix plot
import numpy as np

from matplotlib import pyplot as plt
from pandas.plotting import scatter_matrix

plt.figure()
scatter_matrix(X_train, c=y_train,hist_kwds={'bins': 15}, figsize=(15, 15))
plt.show()
Notice how I’m using the training dataset features (X_train) and the training dataset labels (y_train) to build the scatter matrix.
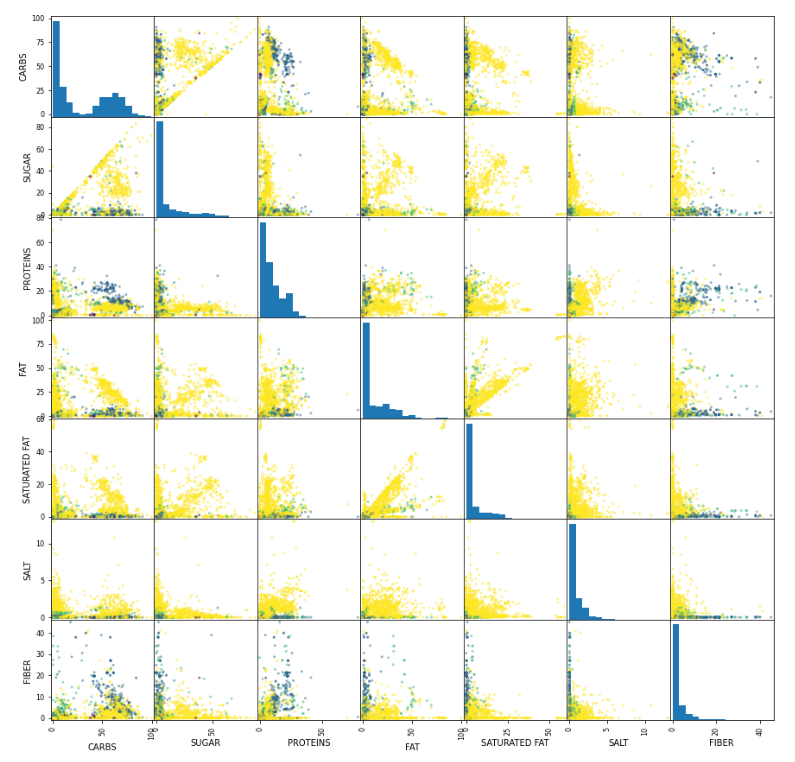
Figure 4. matrix plot
Algorithm selection & configuration
In order to choose the algorithm, I needed to identify first the type of problem I was facing. Why I though this would fit as a Supervised Learning Classification Problem ?
-
First, I’ve got a labeled dataset, so it looked like I could use the labeled data to train a supervised learning model.
-
Second, I was looking for different types of discrete target values (values for green, orange, red), therefore it seemed to be a classification problem.
Once I confirmed it was a classification problem I chose the only classification algorithm I know so far, the k-nearest neighbors algorithm.
Resources
Evaluation Phase
Then we use both, dataset and algorithm, to train a software model to make predictions. Afterwards the model performance is evaluated with testing datasets. Training and testing are part of the evaluation phase.
ML model creation & training
The k-nearest neighbors algorithm is implemented in scikit-learn via the KNeighborsClassifier class. The algorithm tries to establish to which type the element belongs by checking the closest neighborg elements around. You can customize the K parameter which sets how many neighbors does the algorithm have to check before emmiting its veredict.
Here I’m initializing the algorithm with k=5. Then I’m training the model using the fit function and finally I’m checking how well the model is going to perform by passing the testing dataset (X_test, y_test) to the score function. After some tunes here and there I was able to get a 90% of accuracy by using 6 features.
model training and getting accuracy score with the testing dataset
from sklearn.neighbors import KNeighborsClassifier

knn = KNeighborsClassifier(n_neighbors=5)

knn.fit(X_train, y_train)
knn.score(X_test, y_test) # returns 0.9 ==> 90%
ML model testing
To get a prediction I need to provide the following measurements to the model:
-
CARBS
-
SUGAR
-
PROTEINS
-
FAT
-
SALT
-
FIBER
I’m passing as many samples as I want to the KNeighborsClassifier’s predict function and for every sample I’m getting a prediction. Every sample is passed as an array with the required feature values. In this case I’m using another online supermarket dataset to test the model with other datasets than the training and testing datasets.
model prediction
# Every sample has to provide values for
# food_entry = [CARBS, SUGAR, PROTEINS, FAT, SALT, FIBER]

tuna_olive_oil = [0, 0, 20, 33, 0.88, 0]    # expected 3
beer_one_liter = [3.4, 0.1, 0.3, 0, 0, 0]   # expected 2
coke           = [10.6, 10.6, 0, 0, 0, 0]   # expected 3
croissants     = [46, 4.5, 8.7, 26, 1.3, 0] # expected 3

predictions    = knn.predict([
    tuna_olive_oil,
    beer_one_liter,
    coke,
    croissants
])

predictions == [3, 2, 3, 3]
Resources
Optimization
Because I still don’t have a background on optimization procedures, the optimization I did was completely hand-crafted. But I can comment on two tools that I think helped trying to optimize the whole process:
-
scatter matrix. It helped me to see some features that I though for sure they were not going to work well.
-
model score: I used it as a brute force mechanism. I chose the optimal set of features by running the model score until I got what I though it was a compromised between a high score and a reasonable number of features.
I’m sure that, in the future, with more experience, I’ll be able to do a more serious and professional optimization plan.