
Model Evaluation: Multiclass evaluation
So far I’ve been evaluating binary classifiers using different techniques such as:
This time, I’m dealing with a multiclass classification problem, and I’d like to apply some of these techniques too.
The dataset
I’m using the Contraceptive Method Choice Data Set from the UCI machine learning dataset site. This dataset is a subset of the 1987 National Indonesia Contraceptive Prevalence Survey. There are three possible target classes values:
-
1: No contraceptive method used
-
2: Long-Term contraceptive method used
-
3: Short-Term contraceptive method used
Preparing the data
These are the steps I followed prior to build any model:
-
Loading data from csv and naming columns meaningfully
-
Separating possible features from target multiclass column
-
Preprocessing features to normalize scales
-
Oversampling under-represented classes to avoid imbalance
-
Doing feature selection
-
Creating training/test datasets
I’m going to avoid copy/pasting that part here for the shake of briefness. You can check the Jupyter Notebook source for this entry any time.
Building & Evaluating models
In this step I did a small pipeline that took a list of possible classifiers, each one with a set of possible parameters, and it looked for the best outcome for a given scoring strategy. A couple of things to keep in mind:
-
Not every scoring strategy works for a multiclass classification
-
I used GridSearchCV to do cross validation with the different classifiers/parameters
-
I did a stratified cross validation (5 segments)
First, the classifiers, and their possible parameters:
classifiers
from sklearn.svm import SVC
from sklearn.linear_model import LogisticRegression
from sklearn.neighbors import KNeighborsClassifier
from sklearn.tree import DecisionTreeClassifier
from sklearn.ensemble import RandomForestClassifier
from sklearn.ensemble import AdaBoostClassifier
from sklearn.svm import LinearSVC

classifiers = [
    {
        'classifier': SVC(),
        'params': {
            'C': [1, 5, 10, 20, 30, 40]
        }
    },
    {
        'classifier': LogisticRegression(),
        'params': {
            'C': [1, 5, 10, 20, 30, 40],
            'solver': ['newton-cg', 'saga']
        }
    },
    {
        'classifier': KNeighborsClassifier(),
        'params': {
            'n_neighbors': [5, 10, 15, 20]
        }
    },
    {
        'classifier': DecisionTreeClassifier(),
        'params': {
            'max_depth': [3, 4, 5, 6]
        }
    },
    {
        'classifier': RandomForestClassifier(),
        'params': {
            'max_depth': [3, 4, 5, 6]
        }
    },
    {
        'classifier': AdaBoostClassifier(),
        'params': {
            'n_estimators': [50, 60, 75, 100]
        }
    }
]
Every entry of this list is going to be passed (along with the (X,y) data) to the following function in order to extract the best parameters to used to reach the best performance out of the classifier:
extract the best parameters
from sklearn.model_selection import GridSearchCV

def resolve_best_params(classifier_entry, X_param, y_param):
    clsf_instance = classifier_entry['classifier']
    clsf_params   = classifier_entry['params']
    grid_search   = GridSearchCV(
        clsf_instance,
        cv=5,
        param_grid=clsf_params,
        scoring='precision_macro')
    grid_result   = grid_search.fit(X_param, y_param)

    return grid_result.best_params_
In this case I’ve used the precision_macro strategy but you can use any strategy found here as long as it is compatible with a multiclass situation.
Confusion Matrices
Now that we have the classifiers and the function extracting the best parameters, I’m comparing the classifiers using confusion matrices. Unlike the binary classification, in a multiclass classification, the matrix grows to N x N where N is the number of possible target classes. So in this particular scenario we will be dealing with 3x3 matrices.
creating confusion matrices
from sklearn.metrics import confusion_matrix
import seaborn as sns
import matplotlib.pyplot as plt

f, ax = plt.subplots(2, 3, figsize=(15, 10))
cols  = 0
rows  = 0

for clsf in classifiers:
    best_params = resolve_best_params(clsf, X, y)
    classifier  = clsf['classifier'].set_params(**best_params).fit(X, y)
    clsf_name   = type(classifier).__name__

    y_predicted = classifier.predict(X_test)
    matrix      = confusion_matrix(y_test, y_predicted)
    dataframe   = pd.DataFrame(matrix, index=[1, 2, 3], columns=[1, 2, 3])

    ax[rows, cols].title.set_text(clsf_name)
    sns.heatmap(dataframe, cbar=False, square=True, annot=True, fmt='g',ax=ax[rows, cols])
    if cols < 2:
        cols += 1
    else:
        cols = 0
        rows +=1

plt.show()
This is how it looks like:
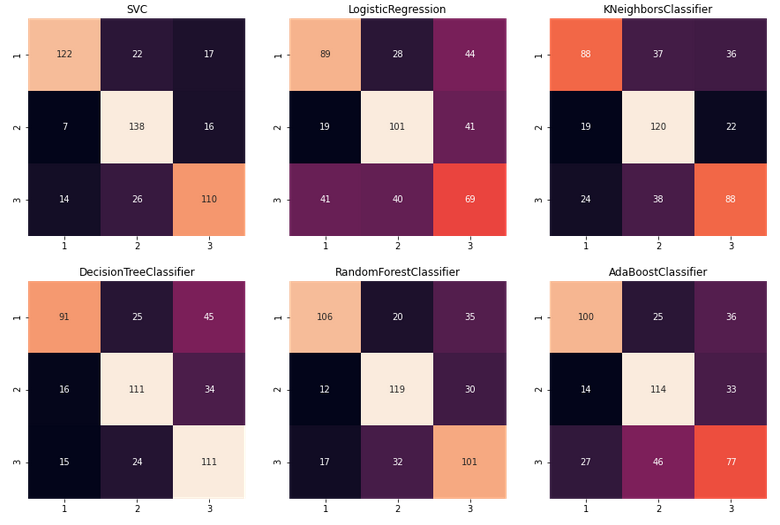
To interpret these confusion matrices you need to remember that the True Positive matches for target classes are the ones in the main diagonal, and the rest are false positives (horizontally) or false negatives (vertically). Lets see an specific example. Lets focus on the target class 1:
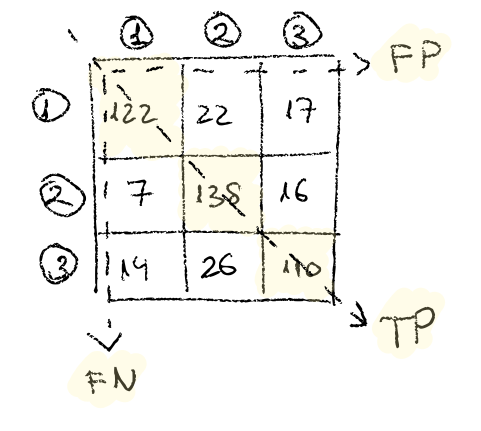
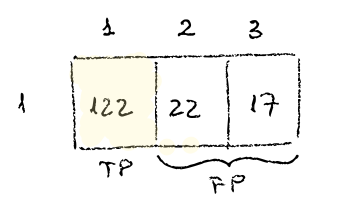
If we focus on the first row, we see that of 122 times the classifier says it’s 1, it is indeed 1, then 22 times says it’s 1 when it is really 2 and 17 times says it is 1 when it turns out it was a 3.
-
122 TP (true positives)
-
22 + 17 FP (false positives).
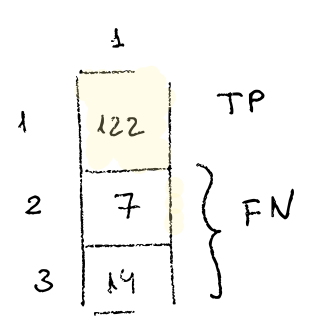
If we focus on the first column, we see that in 122 ocassions says it is 1 correctly, then 7 times says it’s 1 when it should be 2, and 14 times says it’s 1 when it should be 3.
-
122 TP
-
21 FN (7 + 14)
Classification Report
We can also use the classification_report function to show the scoring of the most important metrics. Follow up I’m looping over the list of classifiers to get the classification report of each one of them:
| Remember that the cross validation process has been optimized towards precision with macro average meaning that every class have the same weight when calculating the precision. |
multiclass classification report
from sklearn.metrics import classification_report
for clsf in classifiers:
best_params = resolve_best_params(clsf, X, y)
classifier = clsf['classifier'].set_params(**best_params).fit(X, y)
clsf_name = type(classifier).__name__
y_predicted = classifier.predict(X_test)
report_result = classification_report(y_test, y_predicted)
print()
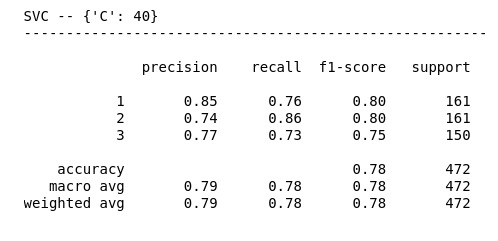
print("{} -- {}".format(clsf_name, best_params))
print('-------------------------------------------------------')
print()
print(report_result)
print()Here’s part of the output of the classification report. We can see how it has the scores for precision, recall, and f1-score for every class, and at the bottom it measures the accuracy for both micro and macro avg.
Resources
-
Contraceptive Methods Dataset: from ICU dataset repository site
-
contraceptive.ipynb: Article Jupyter’s Notebook
-
Imbalanced Classes: Article I did about dealing with imbalanced classes using imblearn